Statistical Analysis of Set of Graphs
My research focuses on defining statistical methods for analysis of sets of graphs. I work on different type of abstract graphs (unlabelled graphs, spatial graphs) as well as different applications (public transport system, brain connectivity, cardiac fibrosis, social networks).
“Lessico Familiare” Scientifico
Let’s define some keywords to put my research interests into context.
Set of Graphs
A dataset where every observation is a graph with a given set of edges, nodes, and attributes.
Unlabelled Graphs
A set of graphs where the graphs don’t share the same set of nodes or where the correspondence between the nodes is unknown or uncertain.
Spatial Graphs
A graph where the nodes have a spatial position. Spatial graphs are also called geometric graphs or spatial networks.
Geometry and Statistics
The field of mathematics focusing on extending statistical methods to spaces which are non Euclidean (manifolds, quotient spaces, stratified spaces, etc.).
Paratransit Mobility
Informal transport systems broadly used in different urban context including Subsaharian cities. Such system are non centralized and non regulated yet efficient and used.
Medical Imaging
I am working with different type of medical images (MRI brain scans, histopathological images of the heart, MRI scan of pancreas tubes).
Metric Statistics for Spatial Graphs
With Arstanbek Okenov, Prof. Panfilov, Dr. Nerlobinsky from Gent University
Geometric graphs (or spatial networks) are graphs with nodes embedded as points in the Euclidean space and edges encoding certain geometrical properties of an underlying object. Such graphs can describe the skeleton of a shape, often depicted in an image. We describe how Fused Gromov-Wasserstein metric can be used to compare different geometric graphs, with different number of nodes and edges. We adjust the metric to leverage out rotations between the graphs and we use the metric to perform clustering and testing procedures. As a motivational case study, we study the geometry and the topology of the cardiac fibrosis in the human heart. Cardiac fibrosis is the pathological increase of fibroblast in the heart. The data consist in histopathological images of human hearts showing cardiac fibrosis. Each image representing the fibroblast is turned into a spatial network via skeletonization. Performing clustering procedure and metric based anova, we address the question of how cardiac fibrosis is structured in terms of its geometrical characteristics, and which is the existing variability between the patients and within a single patient.
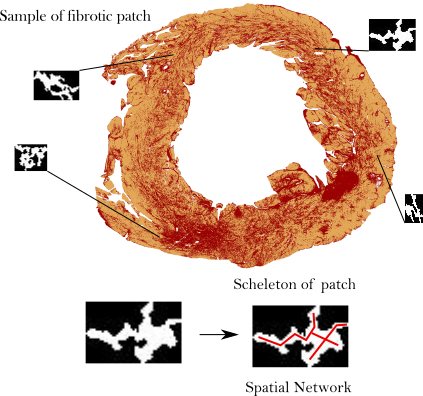
Example of a histopatological image of a heart slice. The red represent the fibrotic tissue. The bottom plot explains how fibrotic tissue is encoded as a spatial graph.
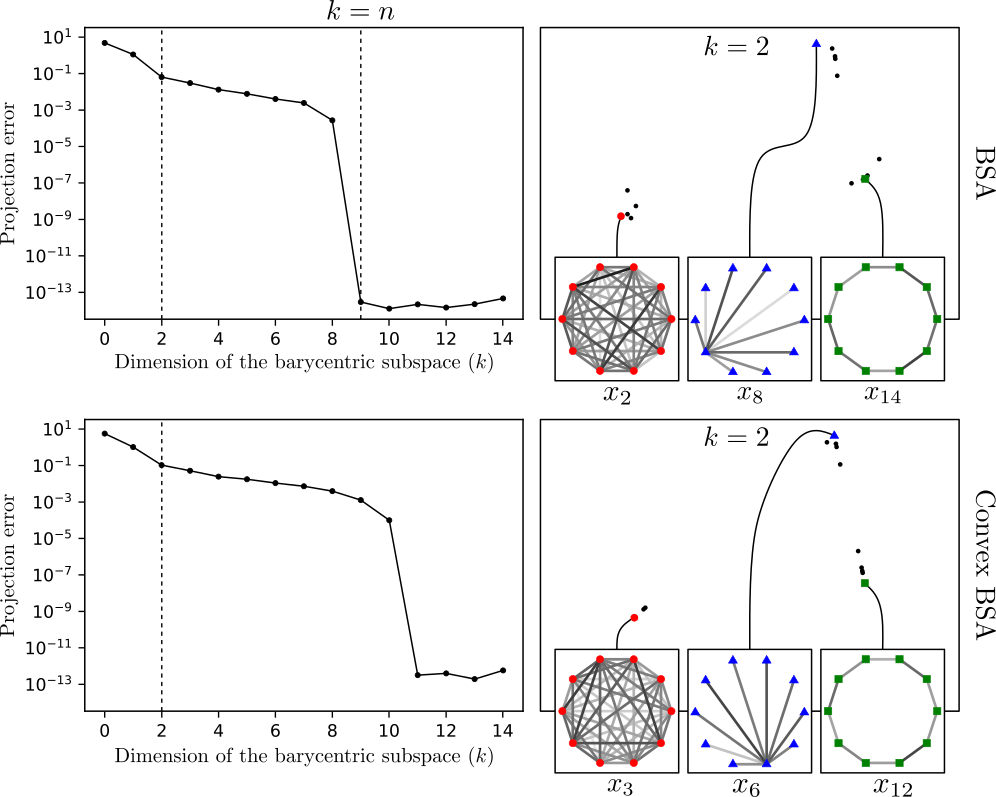
Example of Barycentric Subspace Analysis for a set of simulated graphs. BSA allows to identify sets of reference points (i.e. graphs) which capture a certain amount of variability as shown in the left panel.
Barycentric Subspace Analysis for Unlabelled Graphs
With Elodie Maignant (Zube Institute Berlin), Xavier Pennec (INRIA), and Alain Trouve (ENS, Cachan)
We introduce Barycentric Subspace Analysis for set of graphs as a tool to capture variability with high interpretational power. Set of graphs are studied in graph spectrum spaces, a quotient manifold obtained by applying the orthogonal group action to symmetric adjacency matrices by conjugation. Each equivalence class encode isospectral graphs. Graph spectrum space is isometric to the space of sorted eigenvalues, also known as the Weyl Chamber, where the analysis can be conducted at low computational cost.
Graph alignment with spatial constrains for brain networks
With Theodore Papadopoulo (INRIA), Xavier Pennec (INRIA), Samuel Deslauriers-Gauthier (INRIA)
Every brain is unique, having its structural and functional organization shaped by both genetic and environmental factors over the course of its development. Brain image studies tend to produce results by averaging across a group of subjects, under the common assumption that it is possible to subdivide the cortex into homogeneous areas while maintaining a correspondence across subjects. We investigate this assumption: can the structural properties of a specific region of an atlas be assumed to be the same across subjects? This question is addressed by looking at the network representation of the brain, with nodes corresponding to brain regions and edges to their structural relationships. Using an unsupervised graph matching strategy, we align the structural connectomes of a set of healthy subjects, considering parcellations of different granularity, to understand the connectivity misalignment between regions. First, we compare the obtained permutations with four different algorithm initializations: Spatial Adjacency, Identity, Barycenter, and Random. Our results suggest that applying an alignment strategy improves the similarity across subjects when the number of parcels is above 100 and when using Spatial Adjacency and Identity initialization (the most plausible priors). Second, we characterize the obtained permutations, revealing that the majority of permutations happens between neighbors parcels. Lastly, we study the spatial distribution of the permutations. By visualizing the results on the cortex, we observe no clear spatial patterns on the permutations and all the regions across the context are mostly permuted with first and second order neighbors.
Reference: Calissano et al. 2024
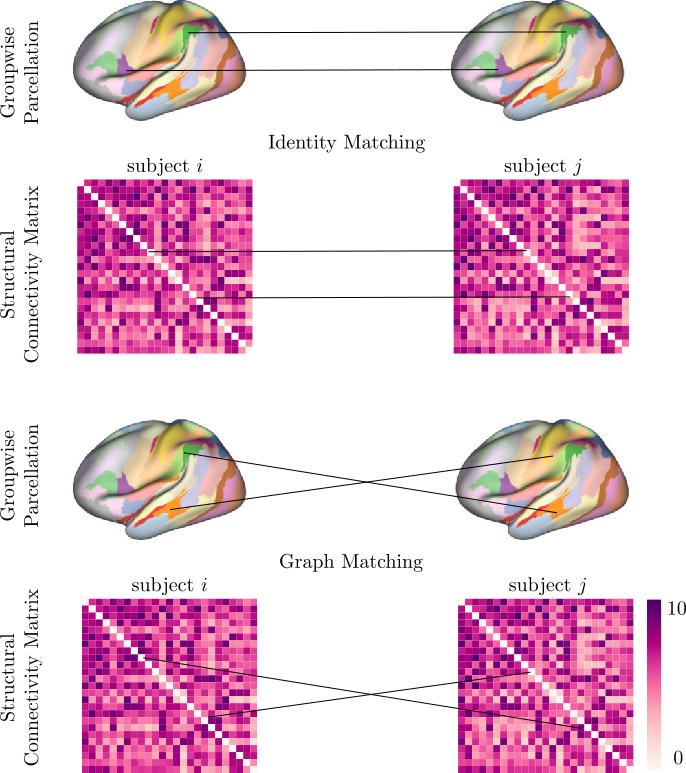
Example of two Structural Brain Connectivity matrices from two subjected in the Human Connectome Project. We show the difference between the identity matching – when the brains are considered aligned – and the graph matching scenario – when the brains might not be aligned and a matching procedure is required.
Graph-Valued Regression Model for Unlabelled Graphs
With Simone Vantini (Politecnico di Milano) and Aasa Feragen (DTU)
Understanding how unlabelled graphs depend on input values or vectors is of extreme interest in a range of applications. In this paper, we propose a regression model taking values in graph space, representing unlabelled graphs which can be weighted or unweighted, one or multi-layer, and have same or different numbers of nodes, as a function of real valued regressor. As graph space is not a manifold, well-known manifold regression models are not applicable. We provide flexible parametrized regression models for graph space, along with precise and computationally efficient estimation procedures given by the introduced align all and compute regression algorithm. We show the potential of the proposed model for three real datasets: a time dependent cryptocurrency correlation matrices, a set of bus mobility usage network in Copenhagen (DK) during the pandemic, and a set of team players’ passing networks for all the matches in Fifa World Championship 2018.
Reference: Calissano et al. (2022)
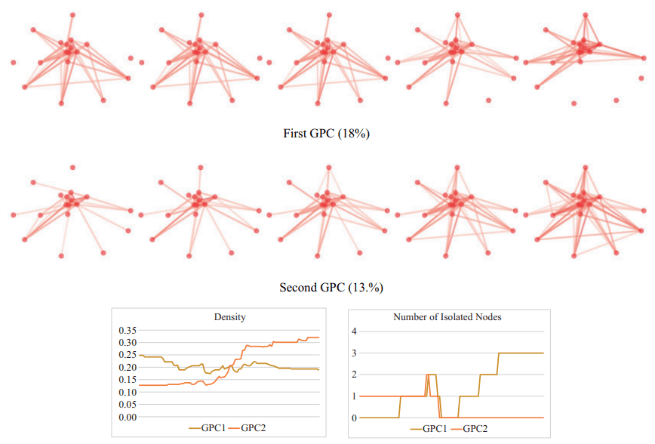
Generalized Geodesic Principal Components for Unlabelled Graphs
With Aasa Feragen (DTU) and Simone Vantini (Politecnico di Milano)
Statistical analysis for populations of networks is widely applicable, but challenging, as networks have strongly non-Euclidean behaviour. Graph space is an exhaustive framework for studying populations of unlabelled networks that are weighted or unweighted, uni- or multilayered, directed or undirected. Viewing graph space as the quotient of a Euclidean space with respect to a finite group action, we show that it is not a manifold, and that its curvature is unbounded from above. Within this geometrical framework we define generalized geodesic principal components, and we introduce the align-all-and-compute algorithms, all of which allow for the computation of statistics on graph space. The statistics and algorithms are compared with existing methods and empirically validated on three real datasets, showcasing the potential utility of the framework. The whole framework is implemented within the geomstats Python package.
Reference: Calissano et al. 2023
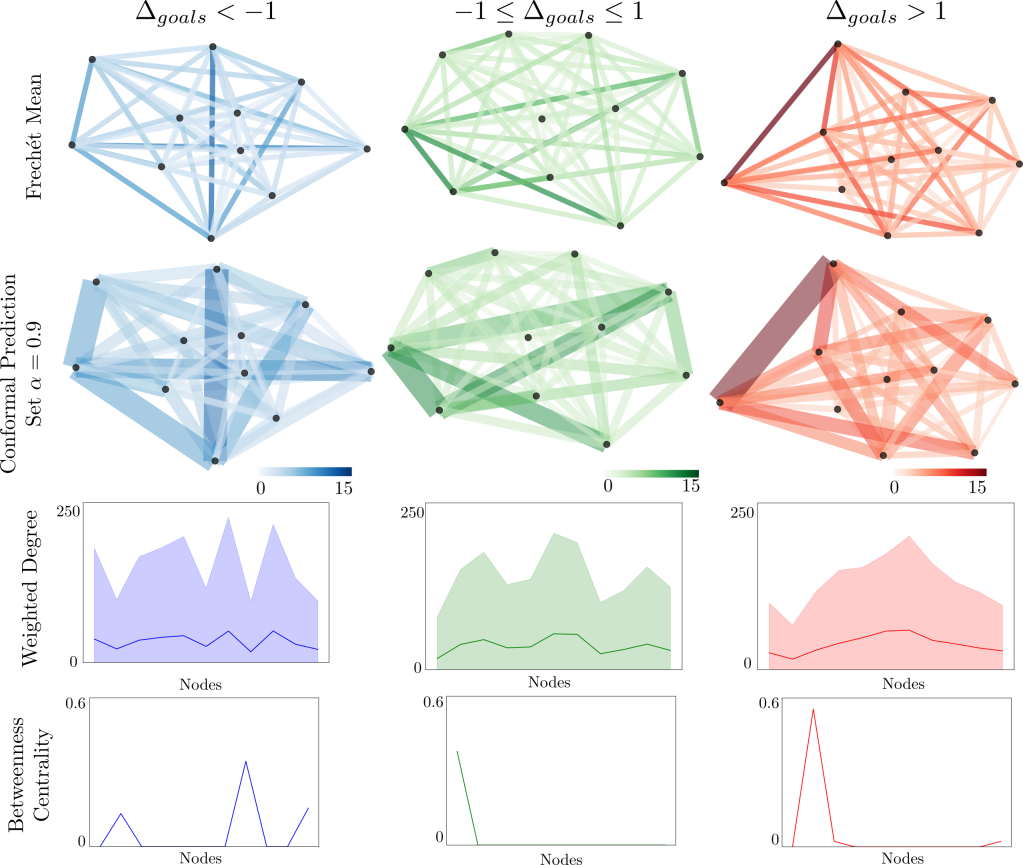
Conformal Prediction Sets for Graphs
With Matteo Fontana (Royal Holloway), Gianluca Zeni, Simone Vantini (Politecnico di Milano)
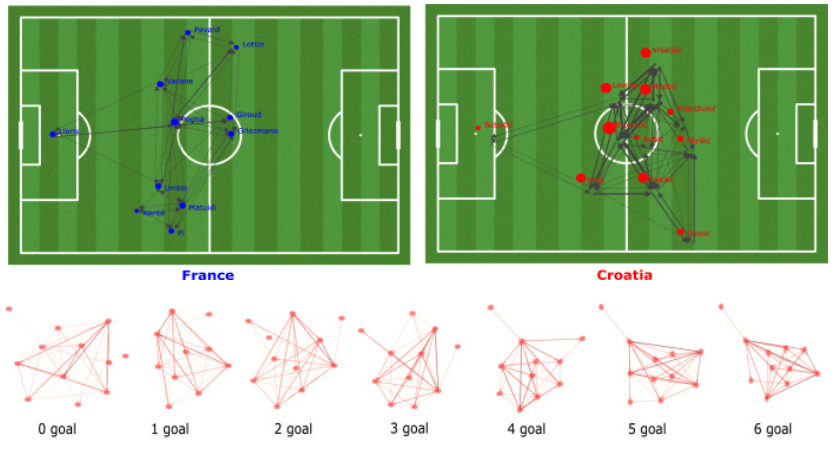
The analysis of data such as graphs has been gaining increasing attention in the past years. This is justified by the numerous applications in which they appear. Several methods are present to predict graphs, but much fewer to quantify the unncertainty of the prediction. The present work proposes an uncertainty quantification methodology for graphs, based on conformal prediction. The method works both for graphs with the same set of nodes (labelled graphs) and graphs with no clear correspondence between the set of nodes across the observed graphs (unlabelled graphs). The unlabelled case is dealt with the creation of prediction sets embedded in a quotient space. The proposed method does not rely on distributional assumptions, it achieves finite-sample validity, and it identifies interpretable prediction sets. To explore the features of this novel forecasting technique, we perform two simulation studies to show the methodology in both the labelled and the unlabelled case. We showcase the applicability of the method in analysing the performance of different
teams during the FIFA 2018 football world championship via their player passing
networks.
.
Reference: Calissano et al. (2024)
Understanding Pratransit Mobility in Maputo, Mozambique
With Michela Arnaboldi (Politecnico di Milano) and Simone Vantini (Politecnico di Milano)
In growing sub-Saharan cities, 80% of the population relies on informal and often unreliable paratransit mobility system. To face transport poverty, there is an urgent need of improving the current offer to fulfil the demand, and finding sustainable solutions. Due to lack of regulations and official data, the standard offer-demand estimation models are not applicable. We hereby develop an offer-demand model centered on the users’ mobility needs: we define an offer-demand bipartite graph. One unique mathematical object jointly models the offer and the demand, how the offer and demand interact, and their spatio-temporal behaves. We showcase how this novel joint model is able to offer a complex and complete overview of the relation between the offer and the demand, to regulate and eventually improve the paratransit mobility with a user oriented prospective.
See Safari Njema for more details!
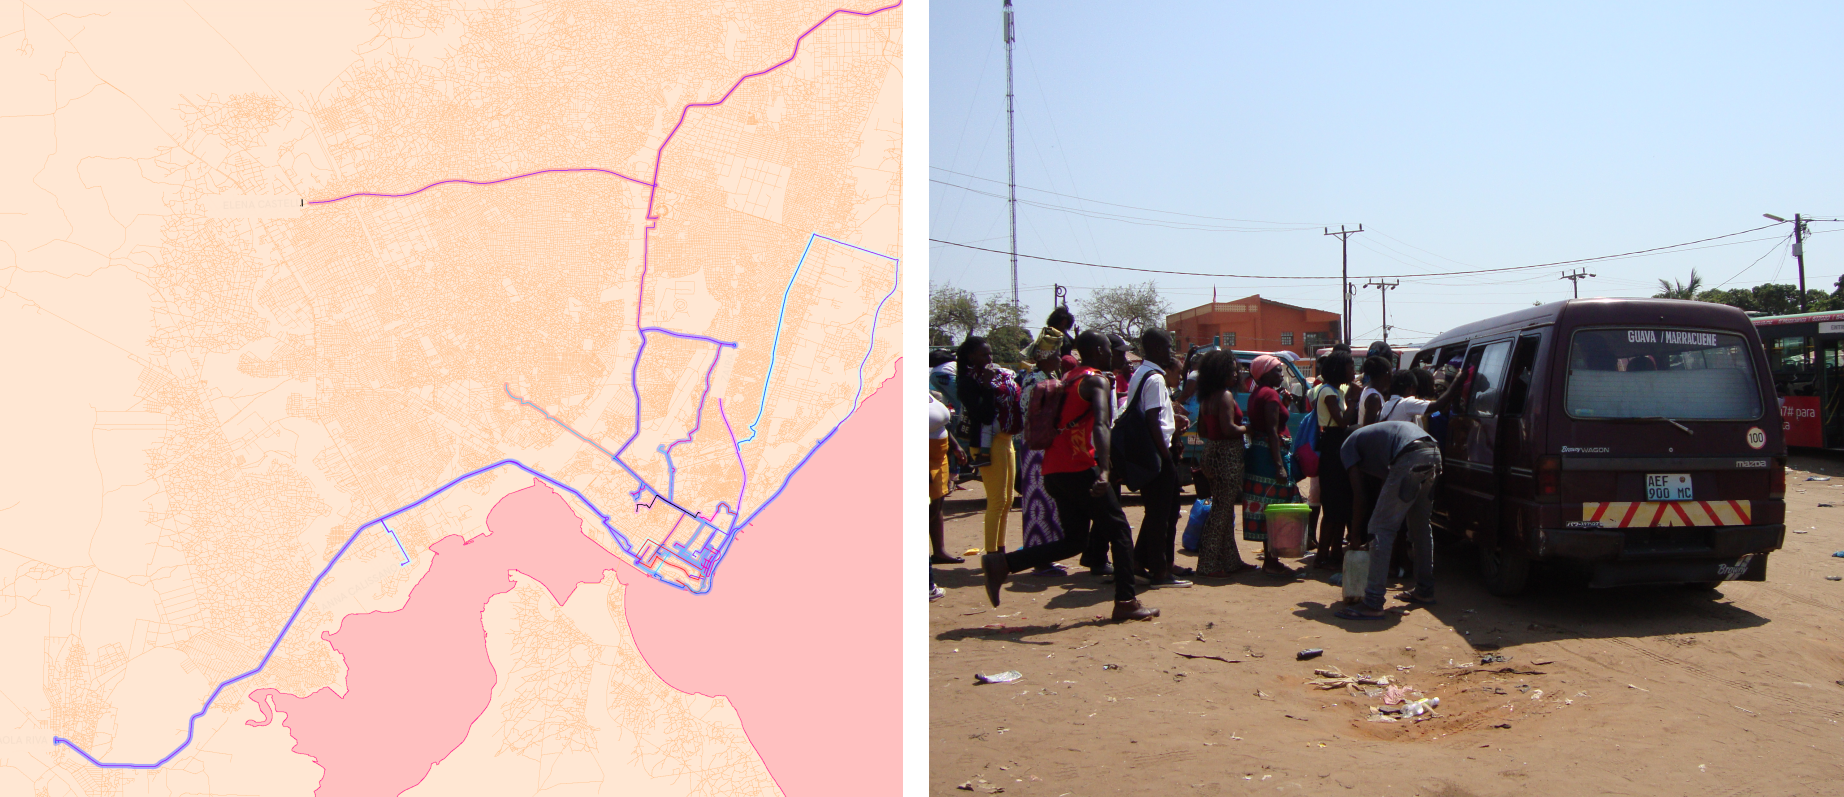
Right: Actual chapas routes sampled during the Mapathon in Maputo collected by us together with students from the local University Eduardo Mondlane. Left: An example of chapas bus and the queue at the stop.
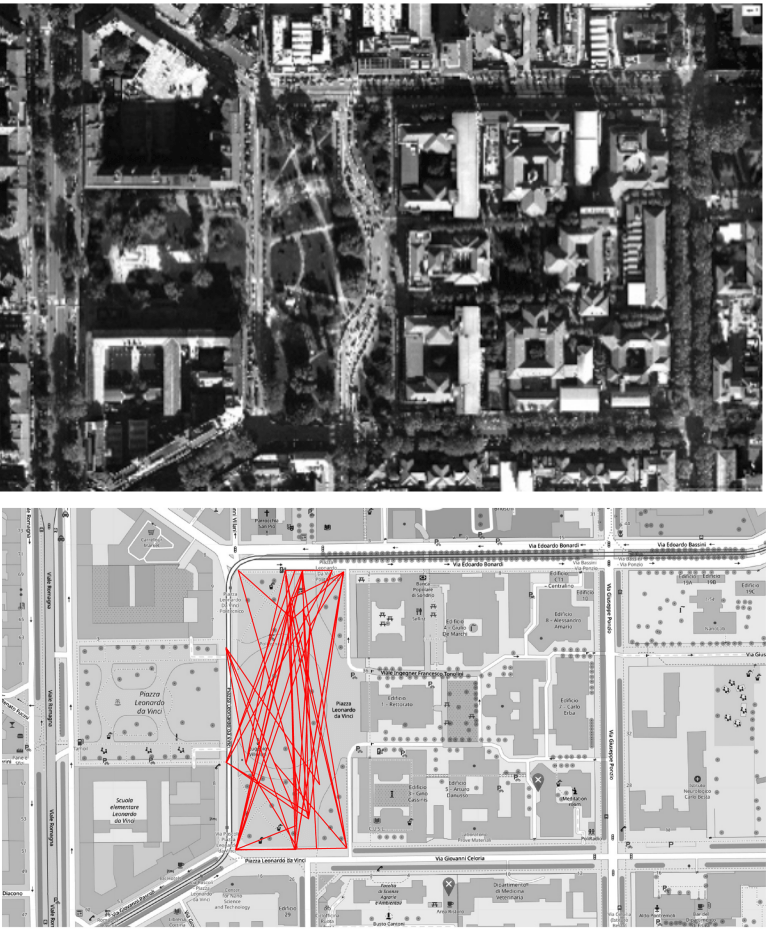
Top: Piazza Leonardo da Vinci, Milano, 2011. Note the pedestrian desire lines in the grasslands. Bottom: simulated pedestrian trajectories in Piazza Leonardo da Vinci. Each trajectory is simulated as a graph with an entry and an exit point, and eventually a seating point and a break at the Kiosk
Landscape Perseption via Human Urban Movment
With Paola Sturla (Harvard GSD) and Simone Vantini (Politecnico di Milano)
The statistical analysis of human movement within the built environment has always been framed in a Euclidean setting. Due to the intrinsic complexity of the urban landscape and how humans interact with it, reductionism is an element that should be taken carefully into account. Extending the mathematical tools to studying complex data and trying to avoid reductionism in the mathematical representation of the problem is the first step to conduct a meaningful and less reductive quantitative study. Object-Oriented Data Analysis (OODA) is a novel statistical approach aiming at going beyond the classic (and sometimes reductive) Euclidean framework. OODA aims at describing the natural complexity of a type of datum such as graphs, text, trajectories, defining a natural geometrical framework for the datum.
Reference: Calissano et al. (2020)
